MLB Betting Model: How to Build a Data-Driven Projection System
A Model Doesn’t Need to Be Complex – It Needs to Be Consistent
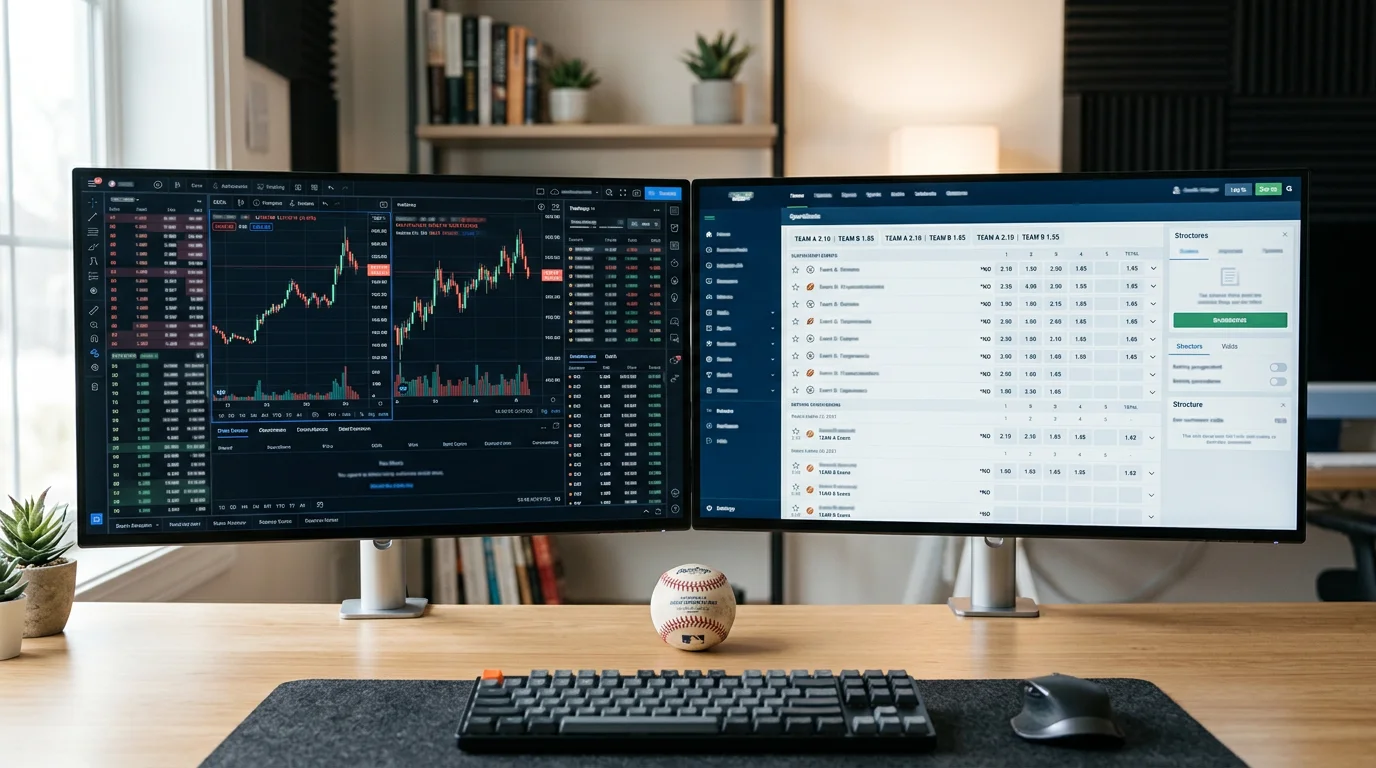
My first MLB betting model was a spreadsheet with six columns. Pitcher FIP, opponent wOBA, park factor, bullpen ERA, a weather adjustment, and a final projected win probability. It took about three hours to build and it was crude by any analytical standard. It also outperformed my gut instincts by four percentage points in its first month. The lesson was clear: a bad model used consistently beats good intuition used inconsistently.
Sabermetric adoption has pushed organizations toward roughly 12% improvement across measurable performance indicators over the past five years, and the same principle applies to individual bettors building their own projection systems. You do not need a machine-learning algorithm or a PhD in statistics. You need a structured process that weighs the same variables the same way every day, removing the emotional biases that sabotage manual handicapping. A model does that automatically.
What I am going to walk through here is not a copy-paste system that guarantees profit. No model does. It is a framework for building your own projection system using freely available data, testing it against actual results, and refining it over time. The bettors who build and iterate models have a structural advantage over those who analyze games ad hoc, because consistency compounds over a 2,430-game season the same way compound interest works in finance.
Core Inputs: Pitching, Offense, Bullpen, Park
Every MLB model, from the simplest spreadsheet to the most sophisticated algorithm, runs on the same four core inputs. The difference between a good model and a great one is not which inputs you use – it is how precisely you measure them and how you weight them relative to each other.
Starting pitching is the single largest driver of game outcomes in baseball. I weight it at roughly 35-40% of my model’s total projection. The key metrics: FIP (not ERA), strikeout rate, walk rate, and ground-ball rate. FIP isolates what the pitcher controls and strips out the noise from defense and sequencing. A pitcher with a 3.20 FIP and a 4.10 ERA is undervalued by the market; one with a 4.50 FIP and a 3.30 ERA is overvalued. I covered the FIP-ERA gap in depth elsewhere – for model purposes, just know that FIP is the metric to use.
Offense gets roughly 25-30% of the weight. I use team wOBA over the last 30 days rather than season-long numbers, because offensive performance is more volatile than pitching and recent form captures platoon shifts, lineup changes, and hot/cold stretches. I also incorporate the lineup’s platoon split against the opposing starter’s handedness. A lineup that mashes right-handed pitching but struggles against lefties will project differently depending on who is on the mound.
Bullpen quality accounts for 15-20% of the model. I measure it using bullpen FIP over the last 14 days, weighted by the specific relievers who are available that day. A team with a 2.80 bullpen FIP but whose closer and setup man both pitched the previous two nights effectively has a compromised bullpen, and the model needs to reflect that. I check bullpen usage logs daily – it takes two minutes and is the input most bettors skip.
Park factor and weather are the final 10-15%. I use a static park factor for each venue, adjusted for game-day wind and temperature using the thresholds I have documented in weather analysis. This is the input that ties the model to the real-world conditions of each specific game rather than an abstract matchup.
Weighting Recent Performance vs. Season-Long Data
One of the biggest decisions in building an MLB model is the lookback window. Do you use full-season stats, which are more stable but slower to capture changes? Or do you use recent performance – last 14 or 30 days – which captures form but is noisier?
After years of testing, I use a blended approach. For pitching, I weight the last 30 days at 60% and season-long data at 40%. Pitchers go through mechanical adjustments, gain or lose velocity, and experience fatigue patterns that recent performance captures better than season averages. A pitcher who was dominant in April but has been shelled in his last four starts is a different proposition than his season-long FIP suggests.
For offense, I weight more heavily toward the recent: 70% last 30 days, 30% season-long. Lineups change more frequently than rotations – injuries, callups, platoon adjustments. A team that lost its best hitter to the injured list two weeks ago will have a lower true offensive output than its season-long wOBA reflects.
For bullpens, I use only the last 14 days. Bullpen composition changes constantly through transactions, injuries, and role shuffles. A bullpen that was dominant in May may have traded its closer at the deadline and look entirely different in August. The 14-day window is short enough to capture the current arms and their workload, which is what matters for tonight’s game.
The weighting is not set in stone. I adjust it twice during the season: once after the All-Star break (when the second-half dynamic shifts, as I discuss in mid-season adjustments) and once in September when rosters expand and the playoff race changes how teams deploy their pitching. These are not radical shifts – I might move the recent-performance weight up by 5-10% after the break and back down in September. Small adjustments that keep the model calibrated to the season’s rhythm.
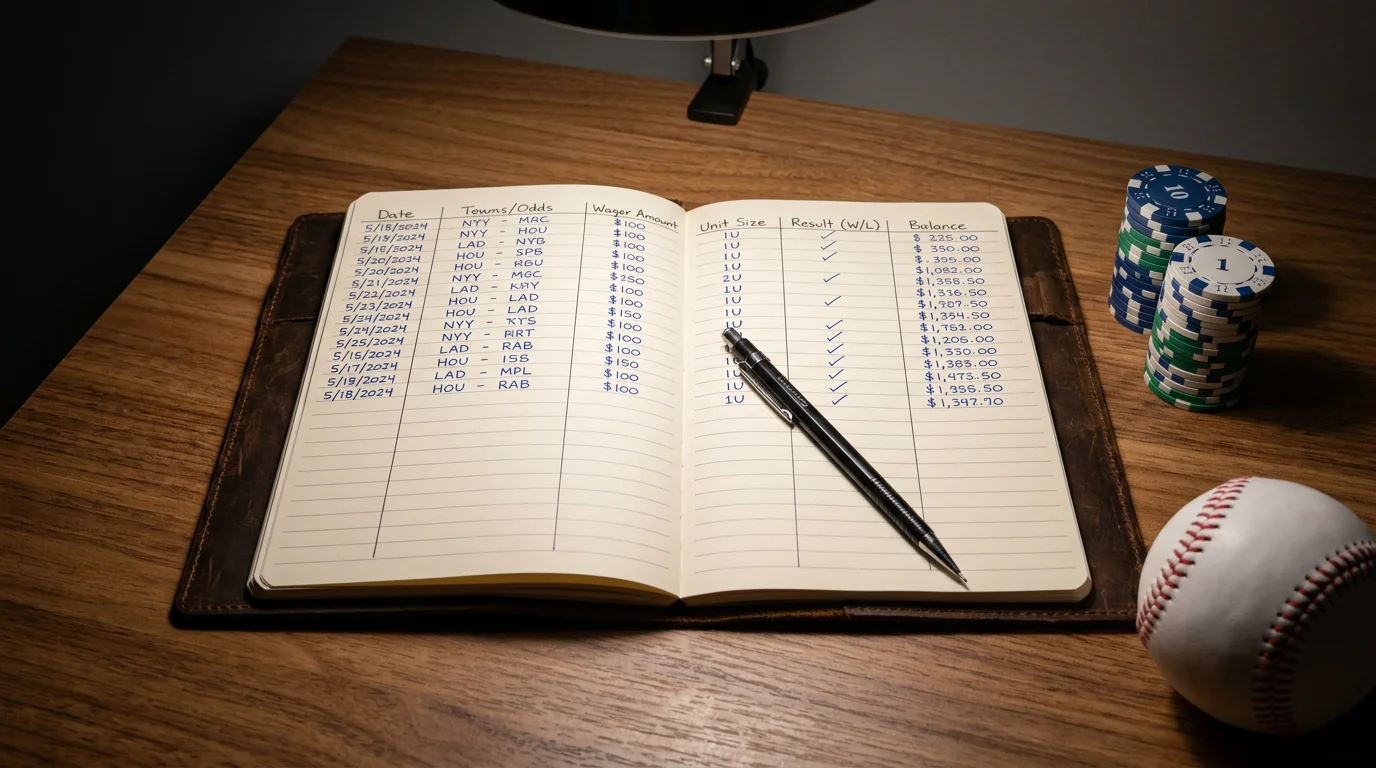
Backtesting Your Model Against Closing Lines
A model that has not been backtested is a hypothesis, not a system. Backtesting means running your model’s projections against historical games and comparing the results to the closing lines and actual outcomes. It is the only way to know whether your model produces actionable edge or just generates noise.
The simplest backtest works like this. Take your model’s projected win probability for every game over a sample of at least 300 games – roughly two months of a full MLB season. Compare your projected probability to the closing line’s implied probability. For every game where your model projects a higher probability than the closing line implies, that is a theoretical bet. Track whether those theoretical bets win at a rate that produces positive ROI after accounting for the vig.
A 2% ROI across 486 bets over a season produces +9.72 units in MLB – a substantial return that most professional bettors would accept. If your backtest shows a 2% or better ROI across 300+ games, your model is likely capturing real inefficiency. If it shows breakeven or worse, you need to revisit your inputs, weights, or both.
I backtest my model against the previous season’s data every March before the new season starts. This tells me whether last year’s weighting scheme still holds or whether the relationship between variables has shifted. Small calibrations during the backtest – moving pitching weight from 38% to 36%, shifting the recent-performance window from 30 days to 25 – can produce meaningful improvement. The key is to make changes based on data patterns, not on hunches about what «should» matter more.
One warning: over-fitting is the biggest risk in backtesting. If you optimize your model until it produces a 10% ROI on last year’s data, you have almost certainly fit the noise rather than the signal, and the model will perform poorly on new data. I aim for a backtest ROI of 2-4% and treat anything above 5% as suspicious. A model that produces modest, consistent edge across multiple seasons is worth far more than one that produces spectacular results on a single historical dataset.
What free data sources can I use to build an MLB model?
FanGraphs provides the most comprehensive free sabermetric data, including FIP, wOBA, BABIP, and park factors. Baseball Reference offers traditional and advanced stats with game logs. Baseball Savant provides Statcast data like exit velocity and barrel rate. For daily lineups and bullpen usage, MLB’s official transaction log and team-specific beat reporters are reliable sources. All of these are free and updated daily.
How many games of data does a new MLB model need before it’s reliable?
I recommend a minimum of 300 games for a meaningful backtest – roughly two months of a full MLB season. Below 300 games, the sample is too small to distinguish genuine edge from variance. For in-season use, your model should run for at least 100 bets before you begin wagering significant amounts based on its output. Use the first 100 bets as a paper-trading phase to identify and correct calibration issues.
Creado por la redacción de «Baseball Bets of the day».