Baseball Bets of the Day: Data-Driven MLB Picks, Strategy & Analysis
Table of Contents
- Why Data-Driven Baseball Bets Win More
- The Numbers Behind Smarter Baseball Wagering
- Types of Baseball Bets: Moneyline, Runline & Totals
- How Starting Pitchers Move the Betting Line
- Weather & Park Factors That Shift Totals
- Sabermetrics Meets Betting: The Metrics That Matter
- Baseball’s Volume Edge Over Other Sports
- How to Spot Value in Today’s MLB Lines
- Bankroll Principles for a 162-Game Season
- The Integrity Landscape: Scandals, Rules & Safeguards
- Responsible Betting: What the Data Actually Shows
- Frequently Asked Questions
Daily baseball bets backed by sabermetrics, weather data, and park factors. Expert MLB picks, strategy guides, and ROI-tested betting angles for today’s games.

Why Data-Driven Baseball Bets Win More
I placed my first baseball bet in 2017 on a gut feeling – a divisional underdog with a «hot» lineup. The team won. I felt like a genius for about twelve hours, until I realized I’d risked $200 to win $140 and had zero framework for repeating the result. That single bet taught me more about what not to do than any tutorial ever could. Nine years later, I build every MLB pick around data, and the difference between those two approaches is the entire point of this guide.
The U.S. sports betting industry generated a record $16.96 billion in revenue in 2025 – a 22.8% jump from the year before. Baseball occupies a unique corner of that market. With 2,430 regular-season games spread across six months, MLB offers more volume than any other major sport, and volume is the engine that turns a small statistical edge into real profit. An NFL bettor with a 2% ROI earns roughly one unit of profit per season. A baseball bettor with the same edge, placing around 486 wagers over a full season, banks closer to ten.
That math is what this guide is built on. I won’t hand you a list of lock picks and wish you luck. Instead, I’ll walk you through every layer of the process I use to identify value in today’s MLB lines – from bet types and pitcher analysis to weather data, sabermetrics, bankroll management, and the integrity issues reshaping the sport’s relationship with gambling. Every strategy here is backed by trackable data, not hunches.
Baseball rewards patience and process over impulse. The strategies in this guide are designed for bettors who want to treat MLB wagering as a long-term, data-driven discipline – not a slot machine.
Whether you’re placing your first baseball bet this spring or refining a system you’ve been running for years, the principles don’t change: find where the market misprices a game, size the bet correctly, and let the volume of a 162-game season do the compounding for you. That’s the framework, and we’re going to break it apart piece by piece.
The Numbers Behind Smarter Baseball Wagering
- MLB’s 2,430-game season turns even a 2% ROI into roughly 9.72 units of profit – nearly ten times what the same edge produces in football’s 51-bet season.
- Starting pitchers are the single largest line-mover in baseball; always confirm listed arms and check FIP-vs-ERA gaps before placing a moneyline or runline bet.
- Wind direction is the most underpriced weather variable in totals markets – inward winds above 5 mph and outward winds above 8 mph create consistent, measurable edges.
- Flat unit sizing at 1-3% of bankroll protects against the inevitable cold streaks across a six-month season; confidence-based sizing is a bankroll killer.
- The $200 pitch-prop cap and ongoing integrity monitoring mean mainstream markets (moneyline, runline, totals) remain the cleanest and most reliable places to bet baseball.
Types of Baseball Bets: Moneyline, Runline & Totals
A buddy of mine once told me he «didn’t understand baseball betting because there’s no point spread.» He’d been wagering on football for years and assumed baseball worked the same way. It doesn’t – and that misunderstanding is one reason baseball markets stay softer than football markets well into the season. If you know how each bet type works, you already have a structural edge over a big chunk of the public.
There are three core markets in MLB betting, and each one rewards a different kind of analysis. Getting clear on these distinctions before you start handicapping games saves time and, more importantly, money.
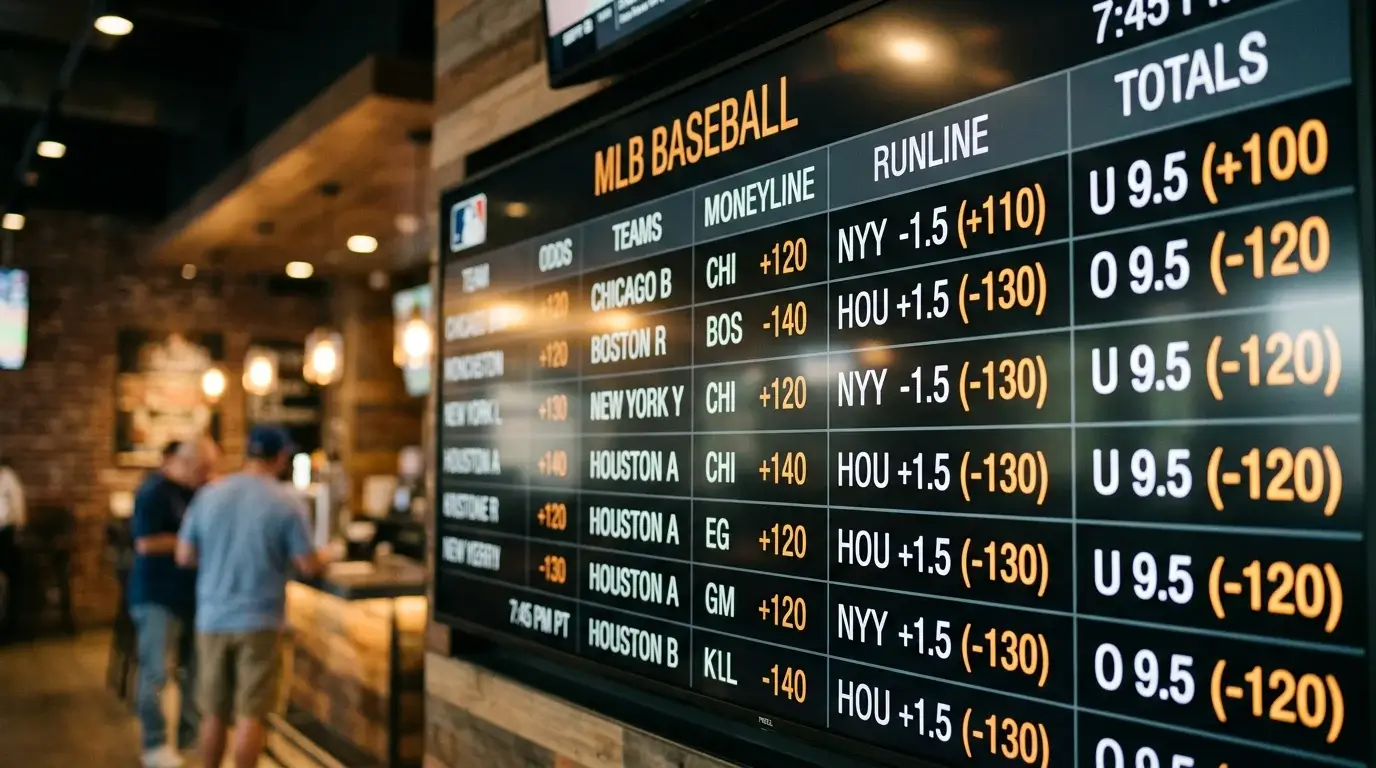
Moneyline – a straight bet on which team wins the game, regardless of the margin. Odds are expressed as a negative number for the favorite (how much you risk to win $100) and a positive number for the underdog (how much you win on a $100 bet).
The moneyline is baseball’s bread and butter. Unlike football, where spreads dominate, the moneyline is the primary market in MLB because run margins are smaller and more volatile. Historically, MLB moneyline favorites win between 58% and 62% of the time, but that win rate alone doesn’t guarantee profit – the juice built into the odds means you need to be selective about which favorites and underdogs you back. I’ll cover how to navigate that trap in the moneyline strategy guide.
Example moneyline: Suppose Team A is listed at -145 and Team B at +125. You’d risk $145 on Team A to profit $100, or risk $100 on Team B to profit $125. The gap between those numbers is the book’s margin – the juice.
Runline – baseball’s version of the point spread, almost always set at 1.5 runs. The favorite must win by 2 or more runs to cover -1.5, while the underdog covers +1.5 by losing by one run or winning outright.
The runline is where I find some of my best value plays during the regular season. When a dominant pitcher faces a weak lineup, the favorite’s moneyline can balloon past -200, making the straight bet capital-inefficient. Switching to the -1.5 runline often gives you plus-money or a much smaller lay, with strong win probability intact. The flip side: backing underdogs on the +1.5 runline can be a conservative play when you like a team but don’t trust them to win outright. For a deeper breakdown of when the runline beats the moneyline mathematically, check the runline strategy page.
Totals (Over/Under) – a bet on the combined number of runs scored by both teams. The sportsbook sets a line (for example, 8.5), and you wager on whether the actual total will be higher or lower.
Totals are arguably the most data-friendly market in baseball. They’re directly influenced by starting pitching, bullpen quality, wind, humidity, temperature, and park dimensions – all variables that are quantifiable before first pitch. If you’re the type of bettor who enjoys building models or running spreadsheets, totals are your playground. I cover the weather and park angles in dedicated sections below, and the over/under strategy page goes even deeper.
Moneyline
Best when: you have a strong read on the winning side and the odds offer value. Avoid when favorites exceed -180 without a clear pitching edge.
Runline
Best when: heavy favorites make moneyline pricing inefficient, or when you want a cushion on an underdog. Requires attention to late-inning bullpen strength.
Totals
Best when: environmental and pitching data align. Wind, park factors, and pitcher matchup quality drive the edge here more than team strength.
Beyond these three, player props have exploded in popularity – bets on individual performance like strikeouts, hits, or home runs. I’ll cover those in a later section, but for now, understand that the moneyline, runline, and totals are the foundation. Master these before venturing into prop markets.
How Starting Pitchers Move the Betting Line
Last April, I watched a line on a mid-market team swing from -115 to -155 in under two hours. No injury report. No weather change. The only thing that happened was the probable pitcher column updated. The scheduled starter got scratched, and the replacement was a top-five arm in the rotation. That single personnel swap moved the implied probability by nearly ten percentage points – and the sharp money hit the line before most casual bettors even noticed.
No other sport gives a single player this much influence over the pregame odds. In football, a quarterback matters enormously, but the line rarely moves 40 cents on a backup-to-starter swap. In baseball, the starting pitcher controls the first five or six innings of a nine-inning contest, and their matchup against the opposing lineup is the single largest variable the book prices in.
How a pitcher swap changes your bet math
Suppose a team is listed at -130 with their number-three starter. Implied win probability: roughly 56.5%. The starter gets scratched, and the ace steps in. The line moves to -170, implying 63%. If your model still says 60%, the value just disappeared – a bet that was +EV at -130 is now -EV at -170.
The takeaway: always confirm the listed pitchers before placing a moneyline or runline bet. A stale line built on the wrong pitcher is one of the most common leaks in recreational betting.
Organizations that have adopted sabermetric frameworks have shown roughly 12% improvements across key performance metrics over the past five years, and the impact is most visible on the pitching side. Traditional ERA tells you what happened. FIP – Fielded Independent Pitching – tells you what the pitcher actually controlled: strikeouts, walks, hit batsmen, and home runs. When a pitcher’s ERA looks great but his FIP is a full run higher, that’s a regression flag. And when the market prices the line based on the shiny ERA number, the gap between surface stats and underlying performance is exactly where your edge lives.
Check pitcher matchups early. Lines are sharpest at game time. If you spot a pitching mismatch before the market adjusts – especially in afternoon games that get less public attention – you can often grab a better number. Track probable pitchers daily and compare them against your own assessments before the line moves.

I track three things for every starting pitcher before I consider a bet: FIP versus ERA gap (is the market overvaluing or undervaluing this arm?), recent workload (has he thrown 100+ pitches in back-to-back starts?), and platoon splits against the opposing lineup (does the lineup stack lefties against a lefty starter, or vice versa?). None of these data points are hidden – they’re available on free sites – but the majority of bettors never layer them together. That lazy gap is a profitable one.
For a full walkthrough on turning pitcher metrics into betting decisions, the sabermetrics guide covers FIP, wOBA, and BABIP in detail.
Weather & Park Factors That Shift Totals
Here’s a scenario I run into at least once a week during the season: two pitchers with solid FIPs, a total set at 7.5, and on paper it looks like a standard under. Then I check the weather forecast for Wrigley, and the wind is blowing out at 12 mph toward left-center. Everything changes. The wind doesn’t care about your pitching analysis, and if you’re not checking environmental conditions before betting totals, you’re leaving one of the most reliable edges in baseball on the table.
Wind is the variable that separates casual totals bettors from serious ones. When winds blow in toward the field at 5 mph or more, fly balls that would be home runs on a calm day die at the warning track. That suppresses scoring in a predictable, measurable way. Conversely, outward-blowing winds above 8 mph carry balls farther, inflating run totals beyond what pitching matchups alone would suggest.
Wind Blowing In (5+ mph)
Scoring tends to drop. Fly-ball pitchers gain an extra advantage. Under bets historically perform well in these conditions.
Wind Blowing Out (8+ mph)
Scoring tends to rise. Even good pitchers give up more extra-base hits. Over bets carry a measurable historical edge here.
Domed / Retractable Roof (Closed)
Weather is neutralized. Focus entirely on pitching and lineup matchups for your totals analysis.
The key detail most people miss: wind direction matters more than wind speed. A 15 mph crosswind has far less impact on scoring than a 10 mph headwind blowing straight in from center field. Checking a basic weather report isn’t enough – you need to understand how the wind interacts with each park’s orientation. For a deep dive into specific wind-angle data and ROI breakdowns, the weather impact guide covers the numbers in full.
Not all ballparks are created equal. Coors Field in Denver, sitting at 5,280 feet of elevation, consistently produces the highest totals in the league – the thin air reduces air resistance on batted balls and causes breaking pitches to flatten. Meanwhile, Oracle Park in San Francisco, with its damp marine air and deep outfield, suppresses scoring even on warm days.

Park factors quantify how much a stadium inflates or deflates run production relative to the league average. A park factor above 1.00 means more runs; below 1.00 means fewer. These numbers get baked into the totals line by oddsmakers, but not always accurately – especially early in the season when small sample sizes make the adjustments imprecise. That’s where a bettor who tracks park factors independently can find value the market hasn’t caught up to yet.
Temperature and humidity play secondary roles. Warmer air is less dense, so balls carry farther in 90-degree heat than in 55-degree April chill. Humidity’s effect is more subtle and often overstated – humid air is actually slightly less dense than dry air, though the practical difference is small enough that I treat it as a tiebreaker rather than a primary factor. The park factors guide walks through stadium-by-stadium data for the full picture.
Bottom line: pitching matchups tell you what should happen in a vacuum. Weather and park factors tell you what happens in the real world. Any serious totals strategy has to account for both.
Sabermetrics Meets Betting: The Metrics That Matter
A few years ago, I was arguing with another bettor about a pitcher whose ERA sat at a gorgeous 2.85. I’d been fading him for weeks and making money. The guy thought I was crazy. Then I showed him the pitcher’s FIP: 4.10. His low ERA was built on an unsustainable BABIP and a defense that was bailing him out on weak contact. Within six weeks, the ERA climbed above 4.00 and the line corrections followed. That’s sabermetrics for betting in a nutshell – the stats that strip away noise and reveal what’s actually happening.
Marc Edelman, a professor of law at Baruch College, once observed that the sports leagues’ approach to the betting relationship amounts to a reactive game rather than a proactive one. I’d say the same thing about most bettors and statistics. They react to ERA, batting average, and win-loss records – the numbers that show up on the broadcast ticker. Sabermetrics forces you to be proactive, to dig beneath the surface stats and find where the market is mispricing a pitcher or lineup.
Traditional Stats
ERA, batting average, RBIs, wins. These measure outcomes that are influenced by teammates, defense, luck, and sequencing. They tell you what happened but not necessarily why – or whether it will continue.
Sabermetric Stats
FIP, wOBA, BABIP, xFIP. These isolate individual performance from external factors. They’re better predictors of future outcomes and expose market mispricings that traditional stats hide.
FIP (Fielded Independent Pitching) – measures a pitcher’s effectiveness based only on events he controls: strikeouts, walks, hit batsmen, and home runs. It ignores fielding, sequencing, and luck on balls in play.
The ERA-FIP gap is the single most actionable metric I use for baseball betting. When a pitcher’s ERA is significantly lower than his FIP, the market is likely overvaluing him – his results have been better than his underlying performance, and regression is coming. Flip it around: a pitcher whose ERA sits a full run above his FIP is being penalized for bad luck or poor defense. That’s a buy-low candidate. I look for gaps of at least 0.50 runs before considering it actionable, and gaps above 1.00 are strong signals.
On the hitter side, wOBA – weighted on-base average – condenses a batter’s total offensive contribution into a single number that weights extra-base hits more heavily than singles. BABIP – batting average on balls in play – acts as a luck indicator. A hitter with a BABIP well above .340 is probably getting some favorable bounces; one sitting below .270 is likely due for positive regression. When I’m evaluating a lineup for a totals or prop bet, I cross-reference wOBA with BABIP to separate real production from noise.
Organizations that have embedded sabermetric analysis into their decision-making have posted roughly 12% improvement across key performance indicators over recent years. The betting market is slower to adopt. Recreational bettors still price games based on gut feelings and box-score stats, which means the gap between what sabermetrics reveals and what the public believes is a persistent source of value. For the full walkthrough on building a sabermetric checklist before placing a bet, the dedicated guide lays it out step by step.
Baseball’s Volume Edge Over Other Sports
I used to bet NFL exclusively. Sixteen regular-season games per team, maybe twenty total wagers a week if I was aggressive with college football too. I’d have a solid year, finish up a few units, and feel good about it. Then I ran the same approach on an MLB season and realized I’d been driving a sports car in first gear. The sheer volume of baseball – 2,430 regular-season games spread from late March through September – changes the math in ways that most bettors don’t appreciate until they see the numbers on paper.
2,430
Regular-season MLB games per year – more than the NFL, NBA, and NHL combined.
~486
Estimated bettable games per season for a disciplined bettor averaging three plays per night.
9.5x
Approximate profit multiplier: a 2% ROI across 486 MLB bets versus 51 NFL bets produces roughly 9.5 times more total units.
The concept is straightforward. Edge multiplied by volume equals profit. A 2% ROI applied to an NFL season of about 51 bets produces roughly 1.02 units of profit. That same 2% edge applied to 486 MLB bets produces 9.72 units. The edge didn’t change. The volume did. Baseball’s long season is a compounding machine, and it rewards the bettor who can identify even a small, consistent advantage.
A baseball season runs roughly 183 days from Opening Day to the final regular-season game. That’s more than twice as many days as the NFL regular season (119 days) and nearly matches the NBA’s schedule length – but with far more games per day, sometimes fifteen or more on a full slate.
Volume also smooths out variance. In a 20-bet NFL sample, a 3-game losing streak wipes out 15% of your bets. In a 486-bet MLB sample, that same 3-game skid is statistical noise – barely a blip. Cold streaks still happen in baseball (I’ve had stretches of 10-15 losses in a row), but they matter less because the sample size is large enough for your true edge to assert itself over time. This is why bankroll management is so critical in baseball – not because the swings are bigger, but because the season is long enough to survive them if you’re sized correctly.
The other advantage most people overlook: the daily grind of baseball creates information asymmetries that don’t exist in weekly sports. Injury reports trickle out hours before first pitch. Lineup cards get posted 90 minutes before the game. Weather shifts. Bullpen availability changes based on last night’s usage. Every one of these updates creates a window where the line hasn’t fully adjusted, and the bettor who’s paying attention can exploit it. In football, the whole world has a full week to digest the same information. In baseball, speed matters.
How to Spot Value in Today’s MLB Lines
There’s a question I ask myself before every single bet: «Would I still take this at the current price if the line moved three cents against me?» If the answer is no, the play probably isn’t a value bet – it’s a borderline lean dressed up as conviction. Identifying genuine value requires separating your opinion on who wins from whether the price is right, and that distinction is the hardest skill in sports betting to internalize.
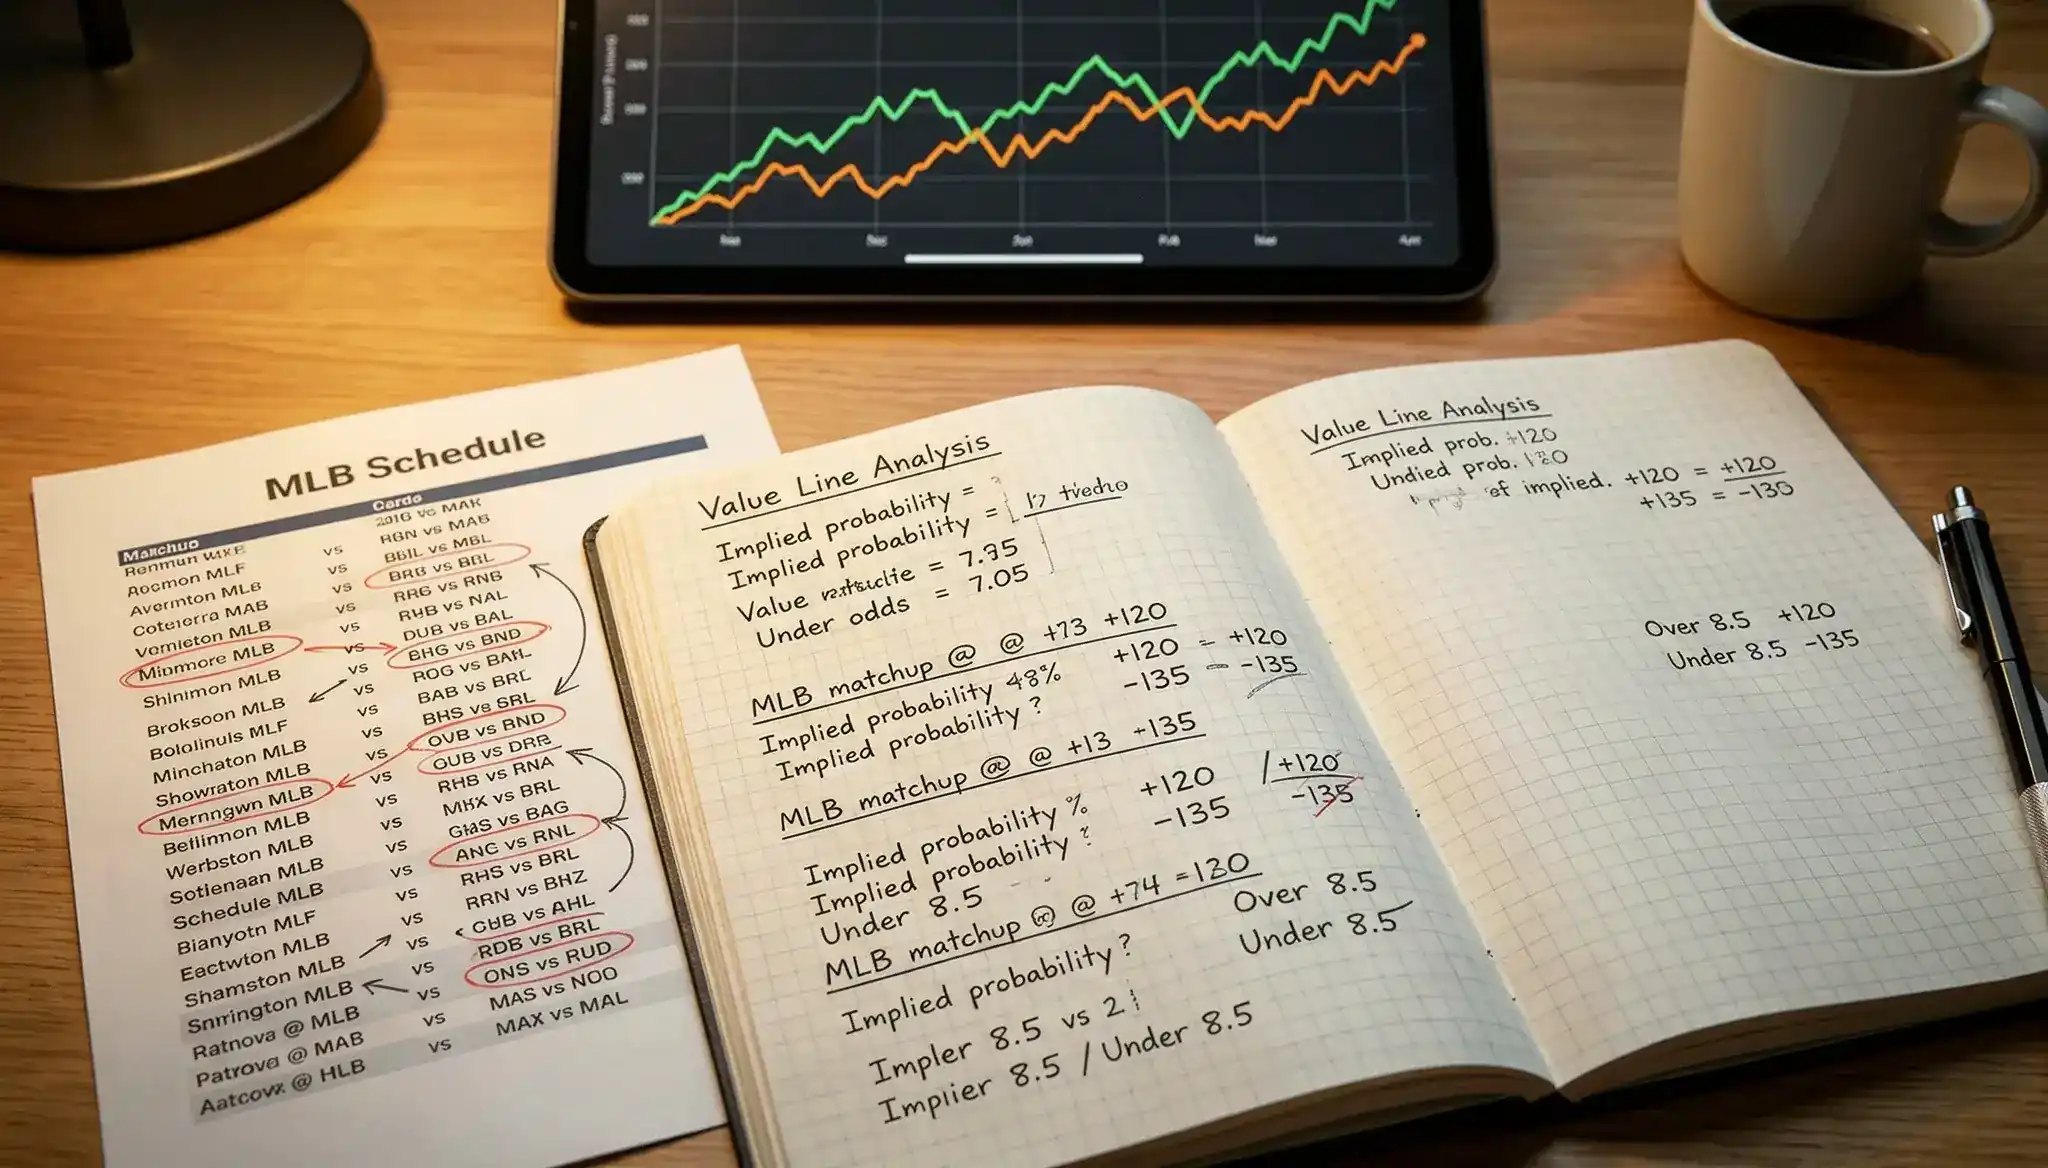
Value exists when the implied probability embedded in the odds is lower than the true probability of the outcome. That’s it. If a team is listed at +130 (implied probability 43.5%) and your analysis says they win 48% of the time, the bet has positive expected value regardless of whether that team actually wins tonight. The market will misprice games regularly across a 2,430-game season – the challenge is developing a process disciplined enough to find and act on those mispricings consistently.
Calculating expected value on a moneyline bet
Suppose you project Team A to win 55% of the time. They’re listed at -125.
Step 1: Convert -125 to implied probability. Formula: 125 / (125 + 100) = 55.6%.
Step 2: Compare your projection (55%) to implied probability (55.6%).
Step 3: Your projection is slightly below the implied probability. This is not a value bet – the book’s price already accounts for (or exceeds) the team’s true win rate. Pass.
Now suppose the same team is listed at -110. Implied probability: 52.4%. Your 55% projection gives you 2.6 points of edge. That’s a play.
In practice, I rarely find value on heavy favorites priced beyond -180. The juice on those prices erodes profit margins fast, even when the team wins. Where I consistently find mispricings is in the middle of the board – teams in the -110 to +140 range where the market’s uncertainty is highest and the book’s line is most sensitive to public sentiment, late scratches, and weather shifts.
The concept of closing line value – CLV – deserves attention. CLV measures whether the odds you locked in beat the price at game time. If you bet a team at +120 and they close at +105, you captured 15 cents of value. Over hundreds of bets, consistently beating the closing line is the strongest indicator of long-term profitability, even more reliable than win-loss record in small samples.
Pre-Bet Value Check
- Have I confirmed the listed starting pitchers and checked for any late scratches?
- Does my projected win probability exceed the implied probability of the current line by at least 2 percentage points?
- Have I checked wind direction, speed, and park factors for totals bets?
- Is the line still moving toward me or has it already been steamed past the value threshold?
- Am I sizing this bet according to my bankroll plan, not according to how confident I feel?
One last thing: value betting is not the same as picking winners. You will lose bets that had positive expected value. That’s how probability works. The discipline is trusting the process across the full season, not abandoning it after a rough Tuesday night. If you want a deeper treatment of expected value calculations and closing line analysis, the value betting guide walks through the math in detail.
Bankroll Principles for a 162-Game Season
I blew my first baseball bankroll in three weeks. Not because my picks were bad – I actually hit 54% of my moneylines that stretch – but because I was sizing bets based on confidence rather than math. A «strong lean» got 10% of my roll. A «lock» got 15%. By the time I hit an inevitable 1-6 skid, half my bankroll was gone and I was making desperation plays to recover. That lesson cost me about $800. The lesson that replaced it – flat unit sizing with strict bankroll rules – has saved me thousands since.
The core principle is simple: your unit size should be small enough that a worst-case losing streak doesn’t knock you out of action. With 486 potential bets across an MLB season, variance will find you. A 2% ROI over that sample is excellent, but it comes with stretches of 10, 15, even 20 consecutive losses mixed in. If your unit size is 5% of your bankroll, a 15-bet cold streak wipes out 75% of your capital. At 2% per unit, that same streak costs 30% – painful, but survivable.
A widely used starting framework: set your standard unit at 1-3% of your total bankroll. For a $1,000 bankroll, that’s $10-$30 per bet. This range gives you enough room to weather cold streaks while still making the math meaningful over a full season. The deeper your bankroll, the lower the percentage can be – which is one reason professional bettors often use 1% or less.
I use flat betting for the majority of my plays – one unit, every bet, no exceptions based on confidence level. The logic: my «high confidence» plays don’t actually win at a meaningfully higher rate than my «medium confidence» plays when I track them honestly. The psychological urge to go heavier on games I feel good about is strong, but the data doesn’t support it. Flat betting removes ego from the equation and lets the edge compound cleanly.
The math behind compounding even a small edge over baseball’s long season is the strongest argument for disciplined bankroll management. As I covered in the volume section, baseball’s game count turns modest edges into meaningful returns – but only if you don’t blow up during the inevitable drawdowns along the way. Setting daily session limits, avoiding parlays as a bankroll recovery tool, and tracking every bet in a spreadsheet are the habits that separate long-term winners from the majority. For the complete system – unit sizing formulas, drawdown management, and parlay allocation – the bankroll management guide covers everything.
The Integrity Landscape: Scandals, Rules & Safeguards
In the fall of 2025, I got a text from a sharp bettor I know: «Pitch props just got nuked.» He was exaggerating, but not by much. MLB had just announced a $200 cap on pitch-level proposition bets and excluded them from parlays entirely. The reason was a scandal that had been building for two years – and it forced every serious baseball bettor to reckon with a question that’s easy to ignore when things are going well: how clean is the market you’re betting into?
The integrity of baseball’s betting market directly affects your bottom line. Manipulated games distort lines, and rule changes in response to scandals reshape entire market segments overnight. Ignoring this landscape doesn’t make you edgy – it makes you uninformed.
The modern era’s integrity crisis centers on two cases. Tucupita Marcano, an infielder, received a lifetime ban from MLB after placing 387 bets on baseball totaling over $150,000 – making him the first active player banned for life in a century. The more consequential case involved Emmanuel Clase, the Cleveland Guardians closer, whose pitch sequences were allegedly manipulated in coordination with bettors who collected at least $400,000 in winnings on rigged pitch-outcome wagers between 2023 and 2025.
The Clase case was the direct catalyst for MLB’s pitch-prop restrictions. Rob Manfred, MLB’s commissioner, framed the rule change as a cooperative effort, noting that pitch-level markets are particularly vulnerable to integrity manipulation. And he’s right – a single pitcher controls every pitch, making micro-level outcomes far easier to influence than game results. The $200 cap and the parlay exclusion are designed to reduce the financial incentive for manipulation, though they also removed a market that some bettors had been profiting from legitimately.
MLB currently contracts with monitoring firms IC360 and Sportradar, which use algorithmic surveillance to flag suspicious betting activity in real time. When unusual line movements or betting patterns emerge – particularly on low-liquidity markets like player props – these systems trigger investigations that can involve both the league and federal authorities. For a deeper look at how these monitoring systems work, see the integrity monitoring breakdown.
These aren’t historical footnotes. Members of the U.S. Senate Commerce Committee have publicly stated that the pattern of manipulation across multiple leagues points to a systemic vulnerability, not isolated incidents. The full historical arc – from the 1919 Black Sox scandal through Pete Rose’s lifetime ban to the Ohtani interpreter case and the modern pitch-prop crisis – is covered in the MLB scandals timeline.
What does this mean for you as a bettor? Three things. First, expect continued regulatory tightening on prop markets, especially anything tied to single-player outcomes at the pitch or plate-appearance level. Second, line movements on low-liquidity props should be treated with more skepticism than mainstream markets. Third, the fact that monitoring systems exist and are actively catching manipulation is actually good news – it means the mainstream moneyline, runline, and totals markets remain among the cleanest in sports betting. Stick to those markets with confidence, and treat any new prop category with appropriate caution until the regulatory framework catches up.
Responsible Betting: What the Data Actually Shows
I debated whether to include this section at all – not because the topic doesn’t matter, but because most betting sites treat responsible gambling as a legal footnote. A tiny disclaimer at the bottom of the page, a 1-800 number nobody calls, and on to the picks. I think that’s dishonest. If I’m going to walk you through strategies for making better baseball bets, I owe you the data on what happens when betting goes sideways. And the numbers are more striking than most people expect.
Twenty-two percent of American adults now have an account with at least one online sportsbook. Among men aged 18-49, that figure jumps to 48%. The market isn’t niche anymore – it’s mainstream, and the growth has been staggering. Cait Huble, Director of Public Affairs at the National Council on Problem Gambling, has called it the largest and fastest expansion of gambling the country has ever experienced, noting that public understanding of the risks lags about a decade behind other forms of addiction.
Eighty-six percent of online bettors believe they can consistently profit from sports betting. Among bettors aged 18-34, that number climbs to 90%. The actual percentage of long-term profitable bettors is in the single digits. The gap between confidence and reality is the single most dangerous dynamic in the market.
The behavioral data is equally sobering. Fifty-two percent of online bettors report chasing losses – placing additional bets specifically to recover money they’ve already lost. Thirty-seven percent have felt shame after a losing session. Twenty percent have lost amounts they couldn’t afford. And there’s a financial displacement effect that doesn’t get discussed enough: research shows that every dollar spent on sports betting reduces investment spending by 99 cents. Bettors aren’t playing with entertainment money – they’re cannibalizing savings and investment capital.
Parlays have grown from 17% of all sports bets in 2018 to 30% in 2024. The growth isn’t driven by sharp bettors discovering some hidden parlay edge – it’s driven by sportsbook marketing that emphasizes massive potential payouts while downplaying the dramatically lower win rates. Understanding why parlays are promoted so aggressively is part of betting responsibly.
None of this means you shouldn’t bet on baseball. It means you should bet with clear eyes. Set a bankroll ceiling that represents money you’re genuinely willing to lose. Use the unit-sizing framework from the previous section to prevent emotional escalation. Track every bet so you have an objective record of your performance, not a memory filtered through recency bias. And if you notice patterns – betting more after losses, hiding bet amounts from people in your life, feeling anxious on days without games to bet on – take those signals seriously. The responsible gambling data page has a fuller breakdown of the research, including self-assessment resources.
I track my ROI meticulously. Some months I’m up. Some months I’m down. The discipline isn’t in the winning – it’s in maintaining the same process regardless of the results, and knowing when to step away from the screen. That’s the most important skill in this guide, and it has nothing to do with sabermetrics.
Frequently Asked Questions
What are the best types of bets for baseball?
The three core MLB bet types are moneyline (picking the outright winner), runline (a 1.5-run spread), and totals (over/under on combined runs). Moneyline bets are the most straightforward and account for the largest share of MLB handle. Runline bets offer better payouts when heavy favorites make the moneyline too expensive. Totals bets are the most data-friendly market because they’re directly influenced by quantifiable factors like pitching matchups, wind, and park dimensions. Your best bet type depends on the specific matchup – there’s no single answer. I use all three throughout the season and choose based on where the data points me each night.
How do starting pitchers affect MLB betting odds?
Starting pitchers are the single most influential variable in MLB odds-setting. A late pitching change can move a moneyline by 30-50 cents in a matter of hours. Books price the line primarily around the pitching matchup, factoring in the starter’s recent performance, career splits against the opposing lineup, and pitch arsenal. That’s why confirming listed pitchers before placing any bet is essential – a line built on the wrong starter is mispriced by definition. Tracking the gap between a pitcher’s ERA and his FIP reveals whether the market is overvaluing or undervaluing him based on surface results versus underlying skills.
What is the runline in baseball betting?
The runline is baseball’s equivalent of a point spread, set at 1.5 runs in nearly every game. If you bet the favorite at -1.5, they must win by two or more runs for the bet to cash. If you bet the underdog at +1.5, they can lose by one run and still cover. The runline is most useful when a dominant pitcher faces a weak lineup – the moneyline on the favorite might be -200 or worse, but the -1.5 runline often sits near even money or plus-money, offering a more efficient payout with a reasonable win probability.
How do weather and park factors influence baseball bets?
Weather and park factors primarily affect totals and, to a lesser extent, runline bets. Wind is the biggest variable: inward-blowing winds above 5 mph suppress scoring by knocking down fly balls, while outward-blowing winds above 8 mph boost scoring by carrying balls farther. Park factors quantify how much each stadium inflates or deflates run production relative to the league average – Coors Field, for example, consistently produces the highest totals due to its elevation. Temperature also plays a role, as warmer air is less dense and allows batted balls to travel farther. Checking these factors before placing any totals bet is a non-negotiable step in my process.
What are MLB prop bets and how do they work?
Player props are bets on individual statistical outcomes within a game – for example, whether a pitcher will record over or under 6.5 strikeouts, or whether a batter will get at least one hit. Game props cover team-level or event-level outcomes like «first team to score» or «will there be a home run in the first inning.» Props are the fastest-growing segment of MLB betting because they allow you to isolate specific matchup advantages. However, they tend to carry higher juice than mainstream markets, and recent integrity concerns have led to restrictions on pitch-level props, with MLB capping those wagers at $200.
Is it profitable to bet on MLB underdogs?
Underdogs are not inherently profitable or unprofitable – it depends entirely on the price. MLB favorites win 58-62% of games historically, which means underdogs win 38-42% of the time. Because underdog payouts are larger, a bettor who can identify situations where the underdog’s true win probability exceeds the implied probability in the odds will profit over time. Certain underdog angles have shown positive historical ROI, particularly when a quality pitcher faces a heavily favored team whose price has been inflated by public money. The key is selectivity, not blanket underdog betting.
How do I read MLB betting odds?
MLB odds use the American format. A negative number like -150 means you must risk $150 to profit $100. A positive number like +130 means a $100 bet profits $130. To convert to implied probability: for negative odds, divide the absolute value by (absolute value + 100). So -150 becomes 150/250 = 60%. For positive odds: divide 100 by (odds + 100). So +130 becomes 100/230 = 43.5%. The gap between the combined implied probabilities of both sides and 100% represents the book’s margin – the juice or vig. The lower the total juice, the better the deal for the bettor.
Creado por la redacción de «Baseball Bets of the day».