MLB Home Run Prop Picks: Data Angles for the Most Popular Player Bet
Home Run Props Are Baseball’s Most Bet Player Market
There is something deeply satisfying about calling a home run before it happens. I remember a May evening in 2024 when I bet a slugger’s HR prop at +280, stacked with a wind-blowing-out reading at Great American Ball Park and a starter whose fly-ball rate was north of 45%. The third inning bomb that cleared the right-field seats by 30 feet felt like a data-driven prophecy. Home run props are the most popular individual player bet in baseball for exactly this reason: the payouts are generous, the variables are analyzable, and the emotional reward is unmatched.
Live and in-play betting accounts for over 62% of the online sports betting market, but pre-game HR props remain one of the few markets where careful analysis can produce consistent value. The key is understanding that home run probability is driven by a specific set of measurable factors – barrel rate, exit velocity, park dimensions, and weather – rather than by reputation or recent streaks. The market prices HR props partly on name recognition and recent performance, which creates gaps for bettors who dig into the underlying data.
Barrel Rate and Exit Velocity as HR Predictors
Two Statcast metrics predict home run output more reliably than any traditional stat: barrel rate and average exit velocity. A barrel, by MLB’s definition, is a batted ball with the optimal combination of exit velocity and launch angle to produce a hit at least 50% of the time and a home run or extra-base hit at a high rate. Barrel rate measures how often a hitter produces these optimal contacts.
The correlation between barrel rate and home run production is the tightest in all of baseball analytics. Hitters in the top 10% of barrel rate consistently slug home runs at two to three times the rate of league-average hitters. More importantly for bettors, barrel rate is a better predictor of future HR production than past HR totals. A hitter who has only five homers by the end of May but ranks in the 90th percentile in barrel rate is more likely to go on a power surge than a hitter with ten homers and an average barrel rate.
Exit velocity adds a second dimension. A hitter who consistently hits the ball at 95+ mph has the raw power to leave the park in any environment. When I evaluate HR props, I check both metrics: barrel rate tells me how often the hitter is squaring up pitches optimally, and exit velocity tells me whether the hard contact translates into potential home run distance. Organizations embracing sabermetric analysis have seen roughly 12% improvement across various performance metrics, and barrel rate is one of the clearest applications of that principle for betting purposes.
The practical workflow: before betting any HR prop, I check the hitter’s barrel rate and exit velocity rankings on Statcast. If both are above the 70th percentile, the hitter has the raw tools to leave the park. Then I layer in the matchup against the specific pitcher – a high fly-ball pitcher with a mediocre fastball is the ideal opponent for a high-barrel hitter. This matchup filter eliminates a lot of props that look attractive based on the hitter’s numbers alone but face a tough pitching matchup that suppresses HR probability.
Stacking Park Factors and Wind for HR Plays
The best HR prop bets stack multiple favorable conditions. Hitter barrel rate is the foundation. The park is the amplifier. And the weather is the catalyst.
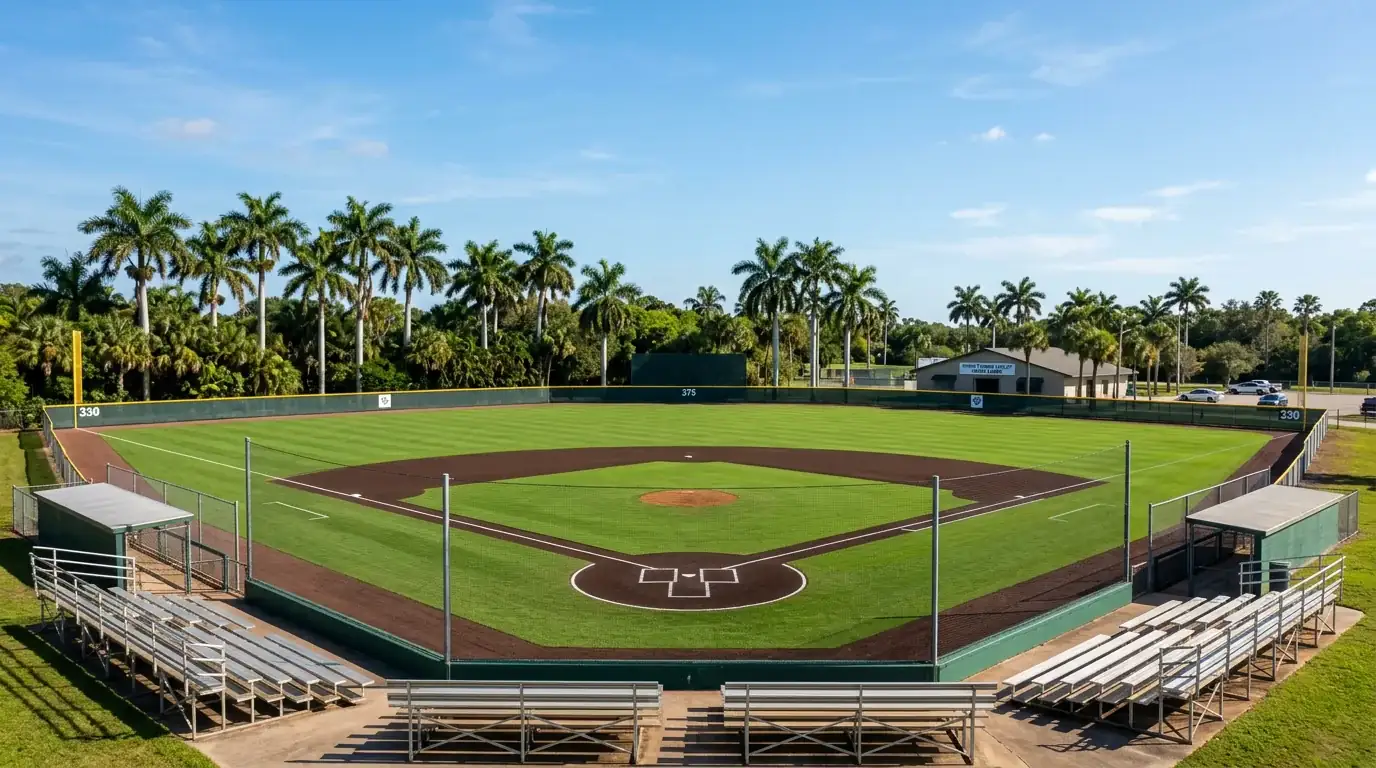
Park factors for home runs vary dramatically across MLB. Coors Field, Great American Ball Park, and Yankee Stadium’s short porch consistently produce HR park factors above 110. Oracle Park, Petco Park, and Tropicana Field typically sit below 90. These differences mean that a batted ball with identical exit velocity and launch angle might be a home run at one park and a warning-track fly out at another. When I see a high-barrel hitter in a high-HR park, the probability stacks in my favor.
Wind blowing out at 8+ mph adds another layer. Data shows that over bets hit at a 52.9% clip when wind is blowing out at that speed, and the effect on HR probability is even more concentrated. A well-hit fly ball that needs an extra 10 feet to clear the fence gets that boost from a strong tailwind. I specifically target HR props when the wind is blowing out at 10+ mph at open-air, hitter-friendly parks – the conditions that maximize carry distance on batted balls.
The player props market does not always fully account for the compounding effect of park plus weather plus matchup. A hitter whose HR prop is set at +300 based on his season-long rate might be a +250 or +220 true probability in specific favorable conditions. That gap is where the value lives. I also cross-reference park factor data to confirm the specific venue’s HR tendency before placing any prop.
Where Books Misprice Home Run Odds
Sportsbooks set HR prop odds using algorithms that weight a hitter’s season-long home run rate, the park factor, and the opposing pitcher’s HR-allowed rate. These algorithms are good but not perfect, and the imperfections create exploitable patterns.
The most common mispricing occurs with hitters on cold streaks. A slugger who has not homered in 10 games will see his HR prop odds lengthen – maybe from +250 to +350. But if his barrel rate and exit velocity remain in the top quartile, the cold streak is likely driven by bad luck or sequencing rather than a decline in power. The book’s algorithm adjusts for the hitless streak, but it underweights the underlying quality-of-contact data. Buying low on a cold-streak hitter with strong Statcast numbers is one of my most reliable HR prop angles.
The reverse mispricing also exists. A hitter on a hot streak with inflated HR numbers but mediocre barrel rate and exit velocity will see his odds shorten. The book treats recent production as signal, but the underlying data says the HR rate is unsustainable. Fading these inflated props – or simply avoiding them – protects against regression.
Platoon mismatches are another source of mispricing. A left-handed hitter with a 30-degree average pull angle facing a right-handed pitcher at Yankee Stadium has a materially higher HR probability than the same hitter at a neutral park against a lefty. The book adjusts for handedness but may not fully capture the interaction between pull tendency, park geometry, and pitcher handedness. Stacking these factors creates HR prop value that the broader market misses.
What Statcast metrics best predict home runs for prop betting?
Barrel rate and average exit velocity are the two most predictive Statcast metrics for home run prop betting. Barrel rate measures how often a hitter makes the optimal combination of exit velocity and launch angle, while exit velocity measures raw power on contact. Hitters ranking in the top 20% in both metrics consistently produce home runs at well above league-average rates, regardless of short-term streaks.
How much do park dimensions affect home run prop odds?
Park dimensions have a substantial impact. HR park factors range from below 85 at pitcher-friendly venues like Oracle Park to above 115 at hitter-friendly parks like Coors Field and Great American Ball Park. That 30-point spread translates to roughly a 30-40% difference in home run probability for the same batted ball. Always check the venue before betting an HR prop – a favorable park can make a marginal prop attractive, and an unfavorable park can make a seemingly good prop a losing play.
Creado por la redacción de «Baseball Bets of the day».