MLB Runline Betting Strategy: When the 1.5-Run Spread Pays More Than Moneyline
Índice de contenidos
The Runline Is Baseball’s Best-Kept Betting Edge
I remember the exact game that converted me into a runline bettor. A team was listed at -220 on the moneyline – a price I would never pay for a regular-season baseball game. But the runline on that same team, -1.5, was sitting at +105. Same team, same game, same pitcher matchup. The only difference was that they needed to win by two instead of one. They won 7-2, and instead of risking $220 to win $100 on the moneyline, I risked $100 to win $105 on the runline. That moment rewired how I think about pricing in baseball.
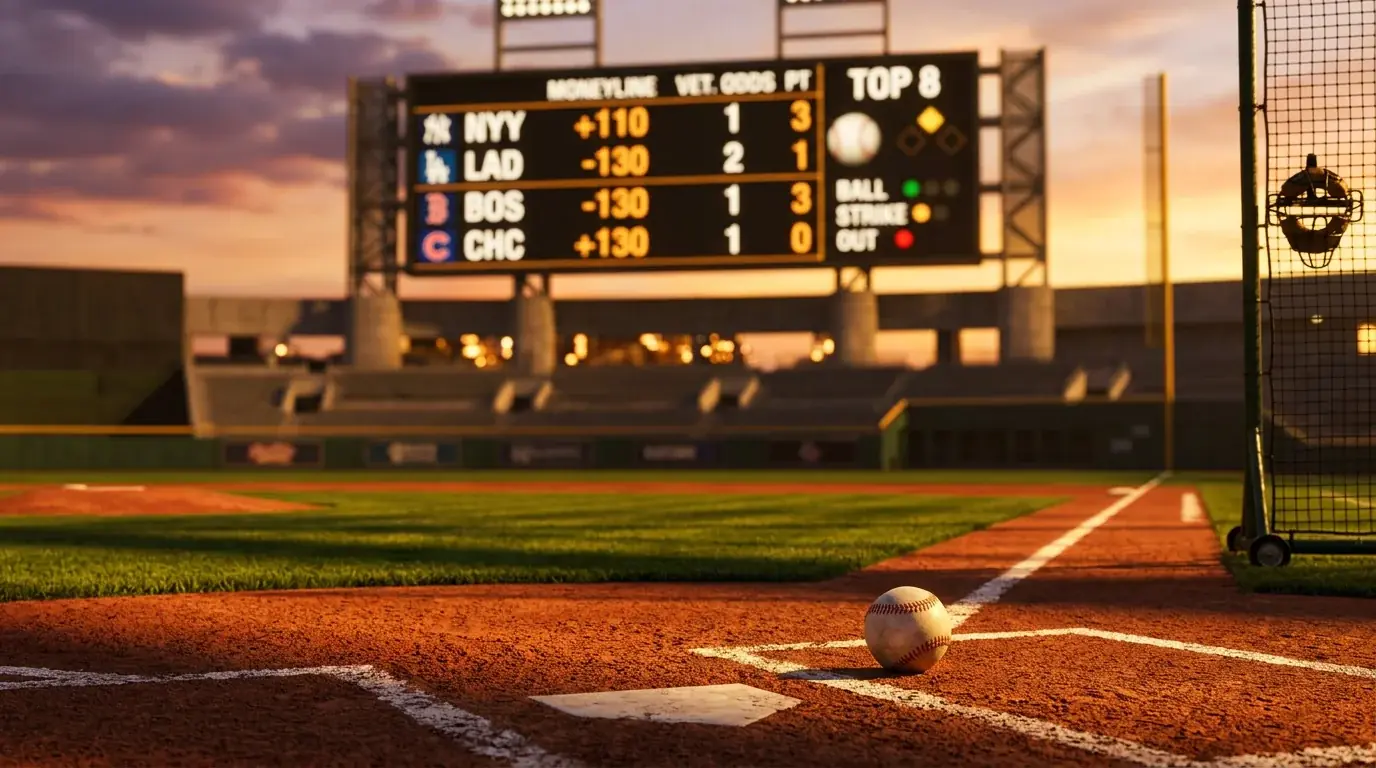
The runline is baseball’s version of the point spread – a 1.5-run line that adjusts the payout based on the margin of victory. Betting a team at -1.5 means they need to win by two or more runs. Betting a team at +1.5 means they can lose by one run and you still cash. Unlike football or basketball spreads, which shift based on the matchup, the baseball runline is almost always fixed at 1.5 runs. What changes is the price attached to it.
This fixed spread creates a unique strategic opportunity. MLB favorites win roughly 58-62% of all games, but among those wins, a substantial percentage come by two or more runs. The question for the runline bettor is straightforward: does the improved payout on -1.5 compensate for the reduced win probability compared to a straight moneyline? In many cases – especially with heavy favorites – the answer is yes. And on the other side of the ledger, the +1.5 underdog bet provides a safety net that can turn a profitable angle into a dominant one.
I have been running runline filters alongside my moneyline analysis for the better part of six years. The data has consistently shown that the runline market is less efficient than the moneyline market, particularly at the extremes – heavy favorites and live underdogs. What follows is a detailed breakdown of when the runline beats the moneyline, how to identify the right spots, and which pitcher and bullpen factors tilt the math in your favor.
Runline Math: When -1.5 Beats the Moneyline Payout
Let me walk through a real scenario to make the math concrete. Suppose a team is priced at -190 on the moneyline. To win $100, you risk $190. The implied probability is 65.5%. Now look at the same team on the runline at -1.5, priced at +120. To win $120, you risk $100. You need the team to win by two or more, but history tells us that when MLB favorites win, they cover -1.5 roughly 60-65% of the time, depending on the price range.
So the critical calculation is this: what percentage of a -190 favorite’s wins come by two or more runs? If the team wins 65% of its games (consistent with a -190 price), and 70% of those wins come by 2+ runs, the team covers -1.5 in approximately 45.5% of all games. At +120, you need a 45.5% cover rate to break even. You are right on the edge. But if the win-by-2+ rate is even slightly higher – 73-75% – the runline becomes clearly superior to the moneyline in expected value.
Where does this calculation consistently favor the runline? Heavy favorites priced at -180 or steeper. At that price point, the moneyline requires an absurdly high win rate to be profitable, while the runline typically prices the same outcome at plus money or short juice. The crossover point varies by game, but as a rule of thumb, any time a moneyline is -175 or worse, I check the runline first. If the runline is offering +100 or better on the same team, the runline is almost always the sharper play.
There is a second mathematical angle that gets overlooked. Moneyline losses at -190 are devastating to your bankroll – you lose $190 for every $100 you were trying to win. On a runline bet at +120, a loss costs you $100. The reduced risk per bet means you can sustain longer losing streaks without catastrophic bankroll damage, and over a 162-game season with 486+ potential betting opportunities, that durability matters as much as the edge itself. If you are serious about managing your bankroll across a full season, the runline’s lower variance profile is a meaningful advantage.
Let me put this into seasonal perspective. Say you make 80 runline bets across a season, all on heavy favorites with a moneyline north of -175. If your -1.5 cover rate is 48% and the average price is +110, your season line reads roughly 38-42 with a positive ROI around 3-5%. Those same 80 games bet on the moneyline at an average of -190 would need a 68% win rate just to break even. The runline lowers the bar from «elite pick accuracy» to «above-average selection with good context.» That shift makes long-term profitability accessible to disciplined bettors who do not have a supercomputer running Bayesian models in the background.
Betting Heavy Favorites on the Runline
A sharp bettor I trade notes with calls heavy-favorite runlines «the market’s gift to patient bettors.» He is not wrong. When a team is priced at -225 on the moneyline, the sportsbook is essentially saying this team will win about 69% of the time. At that level of confidence, the question is not whether the team wins – it is whether the team wins comfortably. And in MLB, comfortable wins are not rare.
The data supports this. Teams priced as heavy moneyline favorites tend to have significant starting pitching advantages, and when an ace is dealing against a bottom-third starter, the run differential expands. Baseball’s 162-game schedule means even a marginal improvement in cover rate – say, 2-3 percentage points above break-even – adds up to meaningful profit over the course of a season. That compounding dynamic applies to runline plays just as strongly as it does to moneylines.
My filter for heavy-favorite runlines involves three criteria. First, the moneyline must be -175 or steeper – below that threshold, the moneyline is usually the better value. Second, the favorite’s starting pitcher must rank in the top 40% of the league by FIP – you need a legitimate pitching advantage to justify expecting a multi-run win. Third, the opposing team’s bullpen must rank in the bottom half of the league by ERA over the last 14 days. That third criterion is the one most bettors miss. Even when the opposing starter keeps the game close through five innings, a weak bullpen opens the door for a late-inning blowout that covers -1.5.
There are traps to avoid. The biggest one: betting a heavy favorite on the runline in a divisional game where the two teams have played each other eight times already. Familiarity compresses run differentials. Divisional games are more likely to be decided by one run, which kills the -1.5 cover rate. I have seen this pattern burn bettors – myself included – enough times that divisional context is now a hard filter in my runline model.
Another trap: the «ace on the road» narrative. A team’s best pitcher starting on the road against a weak opponent looks like a perfect -1.5 setup on paper. But road favorites historically cover -1.5 at a lower rate than home favorites at equivalent prices. Home-field advantage in baseball is modest – roughly 54% win rate for home teams – but the effect on margin of victory is more pronounced than the effect on outright wins. Home teams tend to pile on in the late innings when the crowd is behind them, while road teams with a lead often play conservatively. I weight my -1.5 plays toward home favorites unless the road pitching matchup is overwhelming.
The +1.5 Underdog Angle: Built-In Insurance
If the -1.5 favorite runline is about capturing blowout potential at a better price, the +1.5 underdog runline is about buying insurance on competitive games. And in baseball, most games are competitive. Roughly 30% of all MLB games are decided by exactly one run. That means nearly a third of outright underdog losses would become +1.5 underdog wins. That is not a marginal difference – it is a structural edge.
I started tracking +1.5 underdog runline bets in 2019, and the results have been remarkably stable year over year. The key is price. When a +1.5 underdog is priced in the -180 to -200 range, the juice eats most of the value. You are paying a steep premium for that 1.5-run cushion. But when the +1.5 price sits between -130 and -160, the risk-reward profile is strong. At -150, you need the underdog to either win outright or lose by exactly one run in 60% of games. Given that underdogs win roughly 38-42% of the time and lose by one run in another 12-15%, you are looking at a combined cover rate around 50-57%.
The angle I like best is pairing the +1.5 underdog with a quality starting pitcher. When an underdog has a starter whose FIP is 3.50 or lower, the game tends to stay close through the middle innings even if the team eventually loses. Quality starts by underdog pitchers reduce blowout risk dramatically, and blowouts are the enemy of +1.5 bets. A starter who can get through five innings allowing two or fewer runs gives his team a fighting chance, and that fighting chance is all you need when your bet survives a one-run loss.
One scenario where I stay away from +1.5 underdogs: games with a total set at 9.5 or higher. A high total signals that the market expects offense from both sides, which increases the probability of wide margins. If the total is 7.5 or 8, the game is expected to be tight, and tight games are where +1.5 lives.
There is also a day-of-week pattern worth mentioning. Sunday afternoon games, when teams are wrapping up a series and looking ahead to travel, tend to produce tighter margins than Friday night games where both teams are fresh and the ballpark is packed. It is not a massive effect, but over a full season it compounds. I weight my +1.5 underdog plays slightly toward getaway-day situations where the emotional intensity is lower and game scripts trend toward efficiency rather than drama. Combined with a quality underdog starter, these spots have been among my most reliable runline angles.
Pitcher Quality Tiers and Runline Outcomes
I once had a conversation with a former minor-league pitching coach who told me something I have never forgotten: «Aces do not just win – they demoralize.» That observation has direct runline implications. When a top-tier starter is on the mound, the opposing lineup’s approach changes. Hitters expand the zone, chase more pitches, and press at the plate. The result is not just a win – it is a lopsided one.
For runline purposes, I divide starters into three quality tiers based on a blend of FIP, innings pitched per start, and K-BB ratio. Tier 1 pitchers – the genuine aces with sub-3.20 FIPs who average six-plus innings per start – produce the widest average margin of victory. Games started by Tier 1 arms have historically covered -1.5 at a significantly higher rate than games started by Tier 2 (3.20-3.80 FIP) or Tier 3 (3.80+ FIP) pitchers. As Jason Van’t Hof, formerly with integrity firm IC360, noted about the current landscape, the industry is at a «watershed moment» – and that applies to analytics too, because the data we have on pitcher impact has never been deeper or more granular.
Organizations that have adopted sabermetric-driven evaluation show around 12% improvement across performance metrics. For bettors, this means the tools to tier pitchers accurately are freely available through sites like FanGraphs, Baseball Savant, and Baseball Reference. The edge is not in accessing the data – it is in applying it to runline decisions specifically.
Here is how I apply pitcher tiers to runlines. Tier 1 vs. Tier 3 matchups are the highest-conviction runline plays in my system. The pitching gap creates a snowball effect: the ace suppresses runs early, his team builds a lead, the opposing manager goes to his bullpen earlier than planned, and the game opens up in the late innings. Tier 1 vs. Tier 1 matchups, by contrast, are the worst runline spots – two dominant arms typically produce tight games decided by one run, which is exactly the margin that kills -1.5 bets.
Tier 2 vs. Tier 3 is an overlooked sweet spot. The pitching gap is real but not dramatic enough to draw heavy public attention, which means the runline price tends to be more favorable. I have found more consistent value in this tier matchup than in the marquee ace-vs-ace or ace-vs-back-end scenarios that get all the attention.
Bullpen Depth and Late-Inning Runline Swings
You can do all the pregame analysis in the world, but if you ignore what happens after the starter leaves, you are building your runline thesis on an incomplete picture. I learned this during a brutal three-week stretch in 2021 where my -1.5 favorite bets kept dying in the seventh and eighth innings. The starters were doing their jobs – leaving with two-run leads – but the bullpens were hemorrhaging those leads into one-run margins or outright collapses. Since then, bullpen analysis has been a non-negotiable part of my runline checklist.
The factor most bettors miss is recent workload. A team’s closer might have a 1.80 ERA on the season, but if he has thrown 30+ pitches in back-to-back nights, he is likely unavailable. And the gap between a team’s closer and its sixth or seventh reliever is often massive. When a team’s high-leverage arms are unavailable due to recent usage, the late-inning cushion that protects a -1.5 bet evaporates. I check bullpen usage for the prior two days before placing any runline bet.
On the flip side, bullpen strength creates runline opportunities that the moneyline market does not fully capture. A team with a deep, rested bullpen can protect a two-run lead with far greater reliability than a team relying on tired arms. If the favorite’s bullpen ranks in the top 10 in reliever ERA over the trailing two weeks and has low recent usage, the -1.5 cover probability goes up meaningfully – sometimes by 5-8 percentage points compared to league average.
There is a contrarian angle here too. When a team’s bullpen has been terrible recently – say, a 5.50+ ERA over the last 14 days – the market often overreacts and prices the opponent’s runline too aggressively. But bullpen performance is noisy and mean-reverting. A bad two-week stretch does not permanently break a bullpen. If the underlying reliever talent is still present (check individual pitcher FIPs, not just the aggregate ERA), the market overreaction can create value on both the moneyline and the runline.
The final bullpen consideration for runlines is handedness matchups in the late innings. A left-handed-heavy lineup facing a right-handed closer is a different proposition than the reverse. If the favorite’s expected late-inning pitching sequence matches up poorly against the opposing team’s bench bats and pinch-hitting options, the probability of a late-game rally rises, which directly undermines a -1.5 bet. I do not go deep into platoon splits for every reliever, but checking the closer’s handedness against the core of the opposing lineup takes 30 seconds and has saved me from multiple late-inning runline losses.
Runline Betting FAQ
What happens to a runline bet if the game goes to extra innings?
Extra innings are included in runline bets. If you have a team at -1.5 and they win in extra innings by exactly one run, you lose the runline bet even though they won the game. Conversely, if you have a team at +1.5 and they lose by one run in extra innings, you still cash. Extra innings actually tend to favor +1.5 underdog bets because extra-inning games are disproportionately decided by one run, thanks to the runner-on-second rule that has compressed late-inning scoring.
Is the runline better for betting favorites or underdogs?
Both sides have distinct advantages. The -1.5 favorite runline is strongest when heavy favorites (moneyline -175 or worse) are paired with Tier 1 starting pitchers and the runline price is at or near plus money. The +1.5 underdog runline is strongest when the underdog has a quality starter and the game total is set at 8 or below, suggesting a tight game. Neither side is universally better – it depends on the matchup, the price, and the context.
How do blowout-prone teams affect runline value?
Teams that tend to win or lose by wide margins are natural runline targets. On the -1.5 side, a team that wins by 3+ runs in a high percentage of its victories is undervalued on the runline because the market prices based on overall win probability, not margin of victory. On the +1.5 side, a team that plays a disproportionate number of one-run games is undervalued because that pattern suggests close, competitive contests where the 1.5-run cushion frequently comes into play.
Can I combine runline bets in parlays?
Yes, runline bets can be parlayed. However, combining two or more -1.5 runline favorites in a parlay compounds the risk significantly. Each leg needs to win by two or more runs, and one close game torpedoes the entire ticket. If you parlay runlines, limit yourself to two legs and mix -1.5 favorites with +1.5 underdogs to create correlation – for example, pairing a heavy favorite at -1.5 with the opponent’s rival at +1.5 in a different game where you expect a tight contest.
Creado por la redacción de «Baseball Bets of the day».